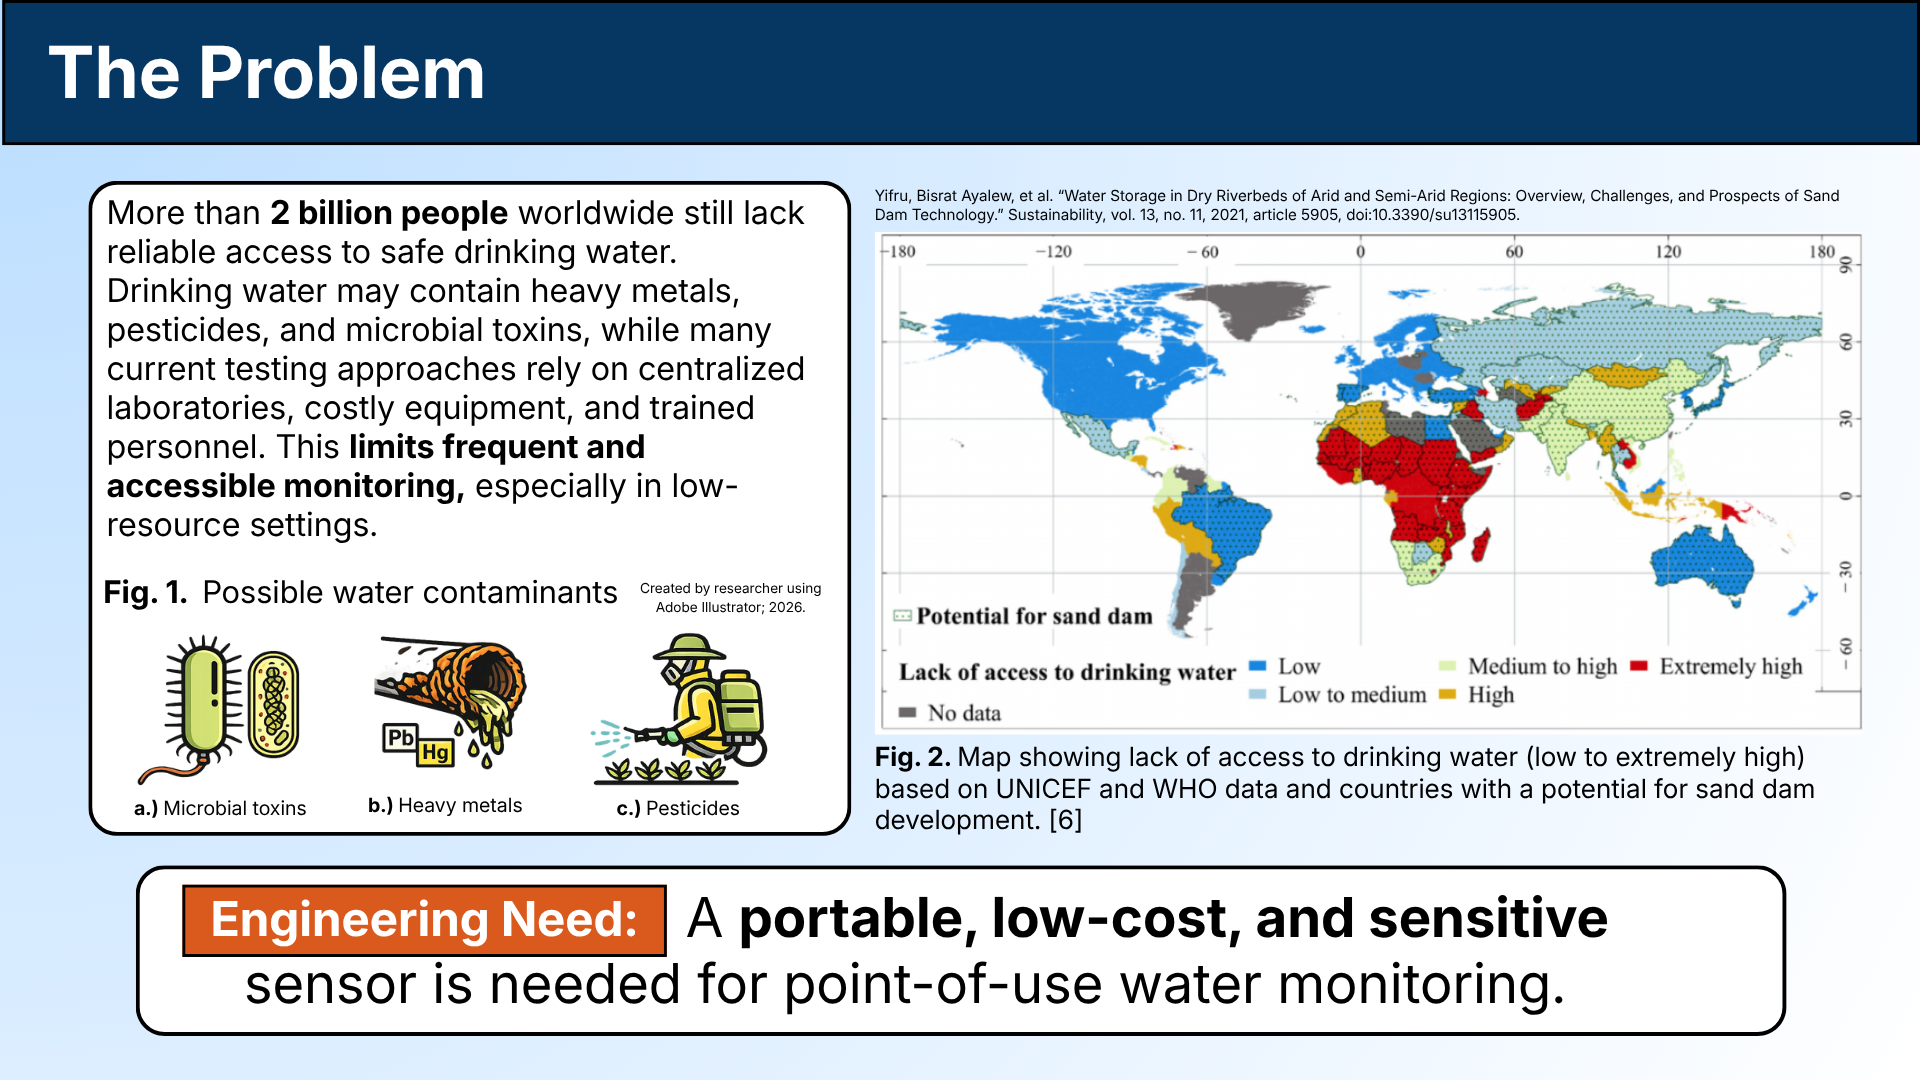
Low-cost optical water sensing
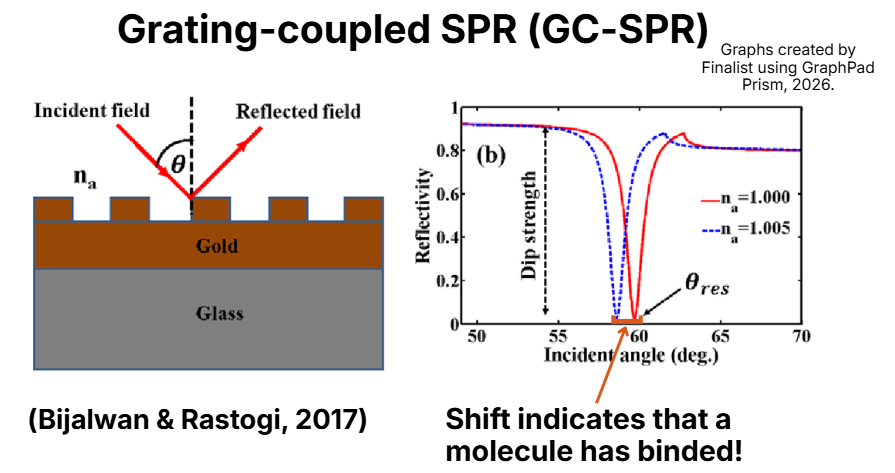
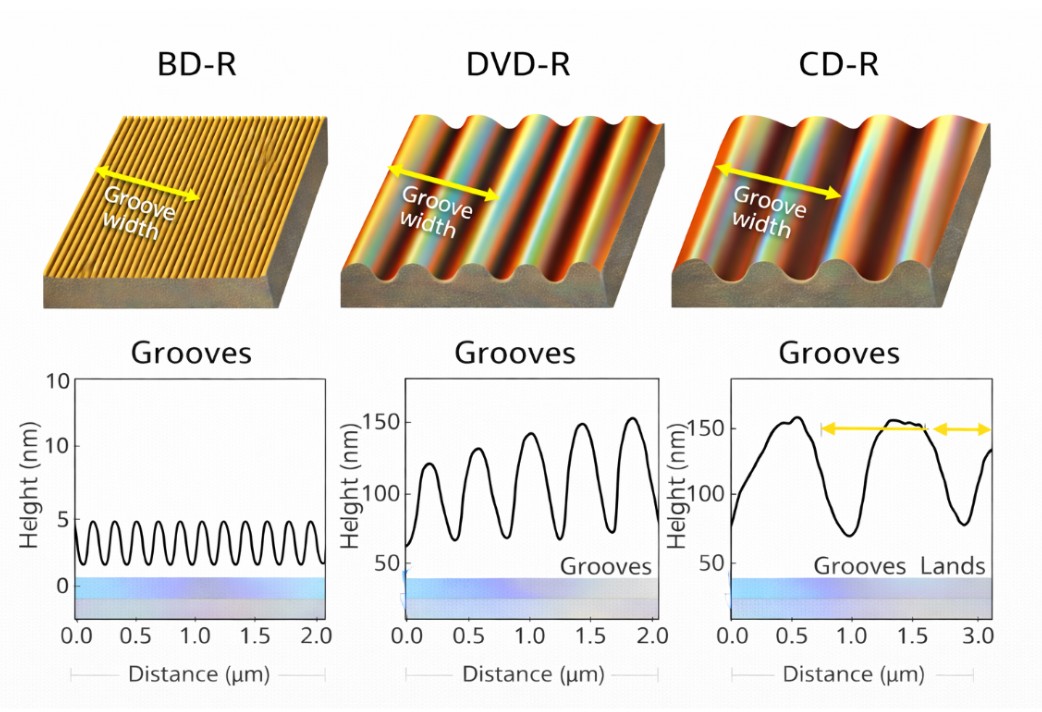
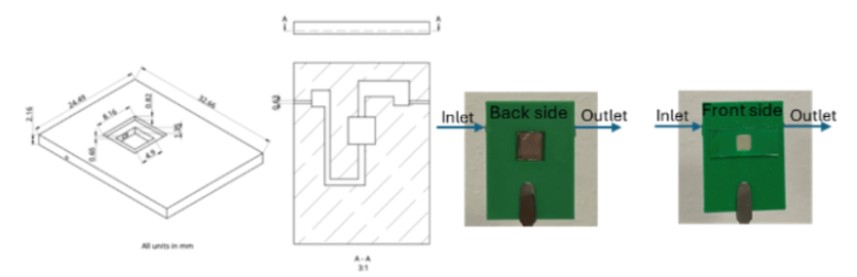
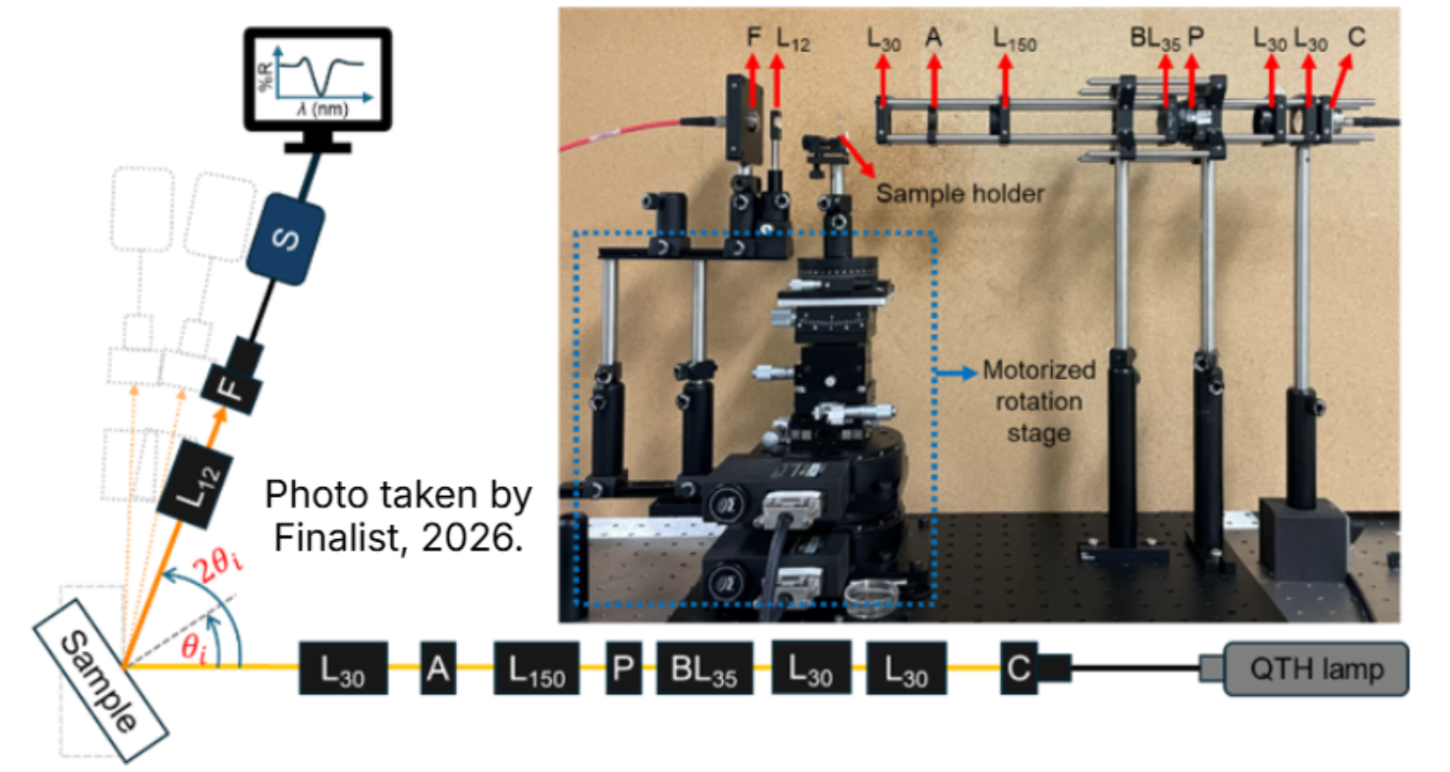
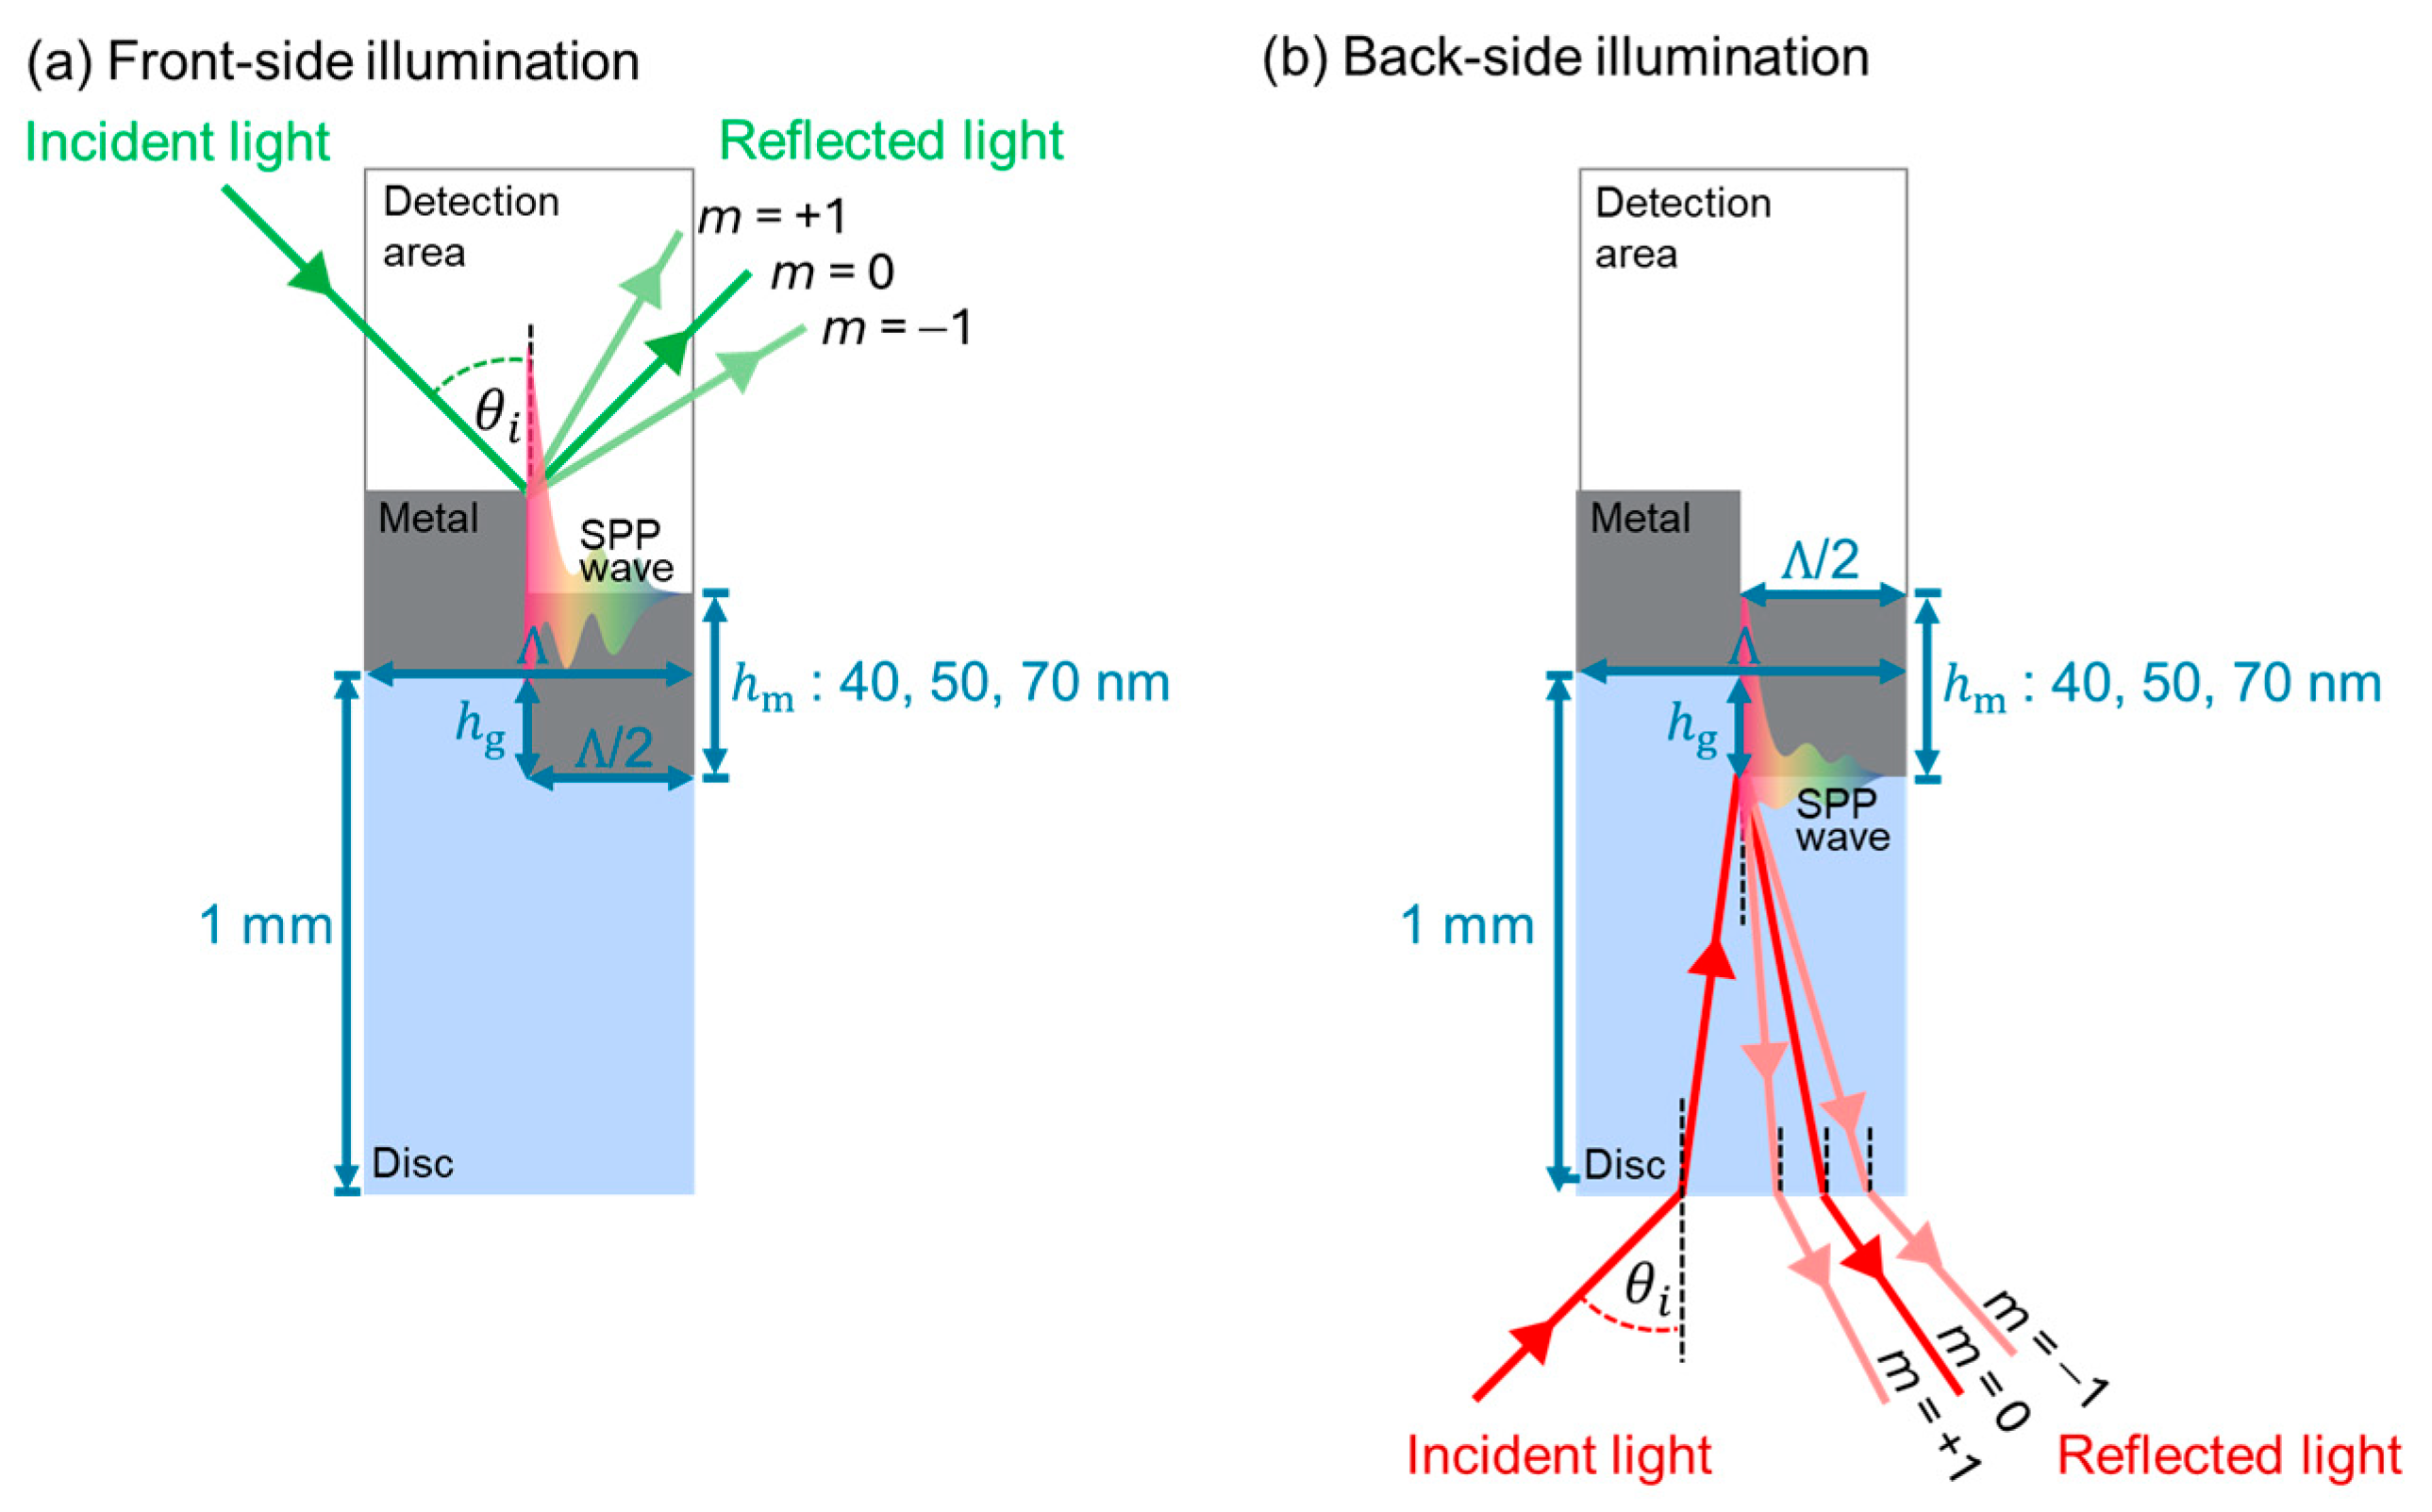
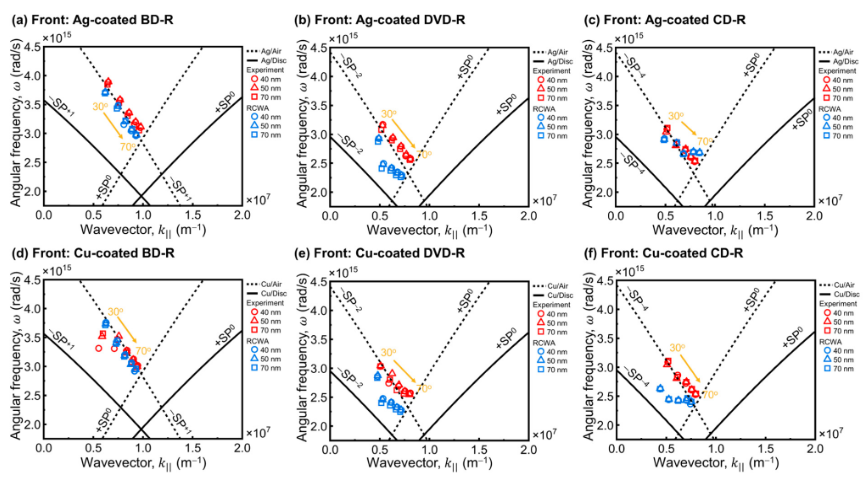
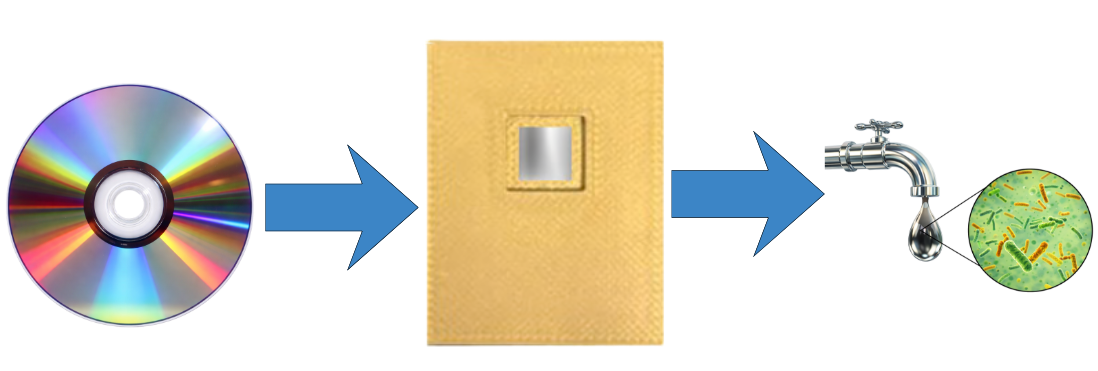
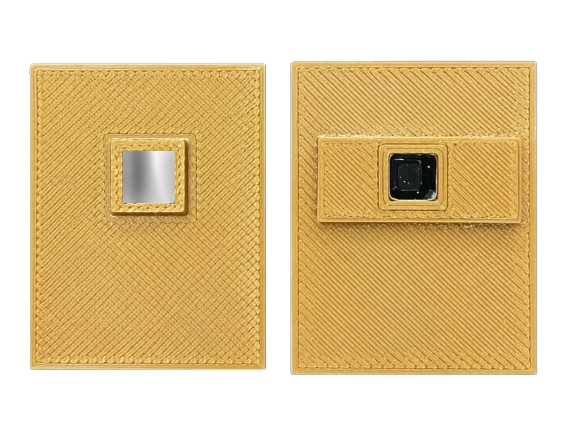
DiscSPR
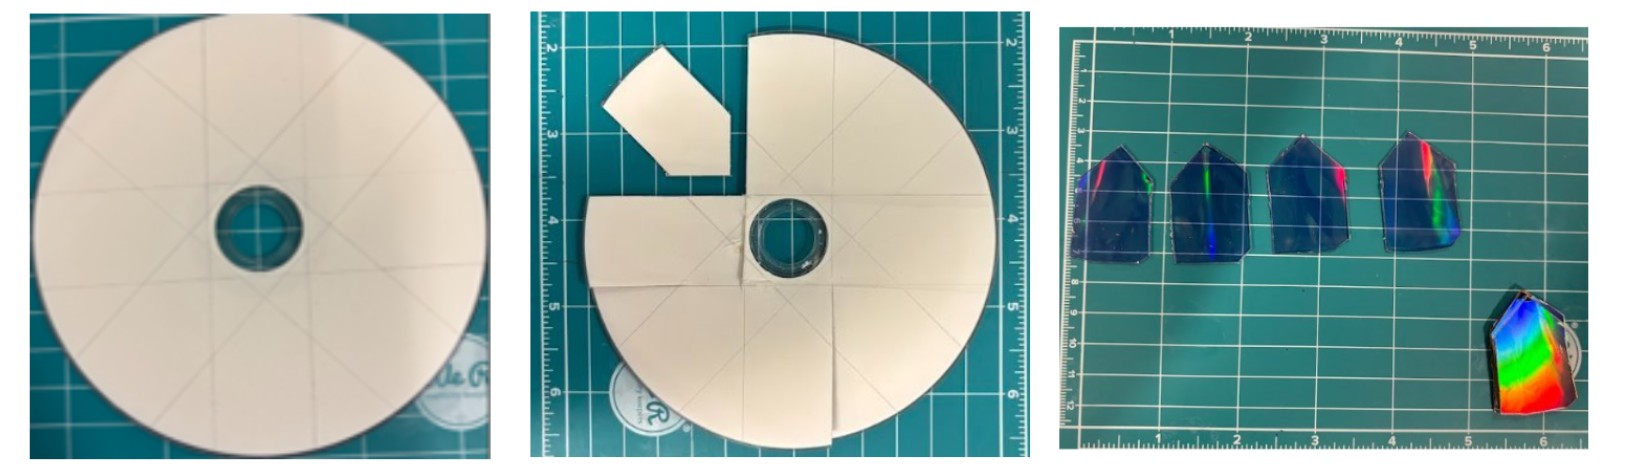
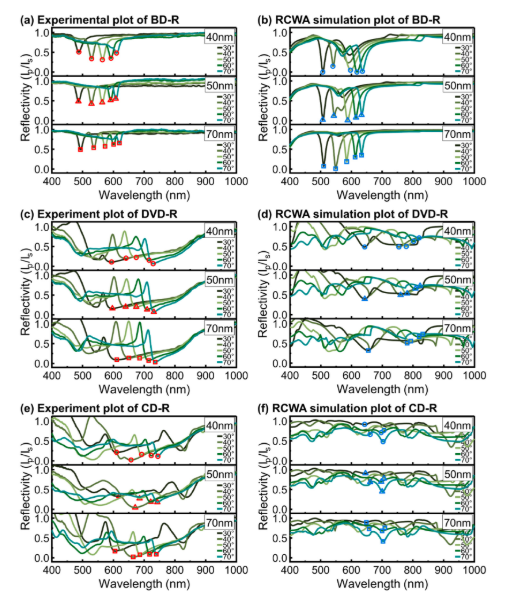
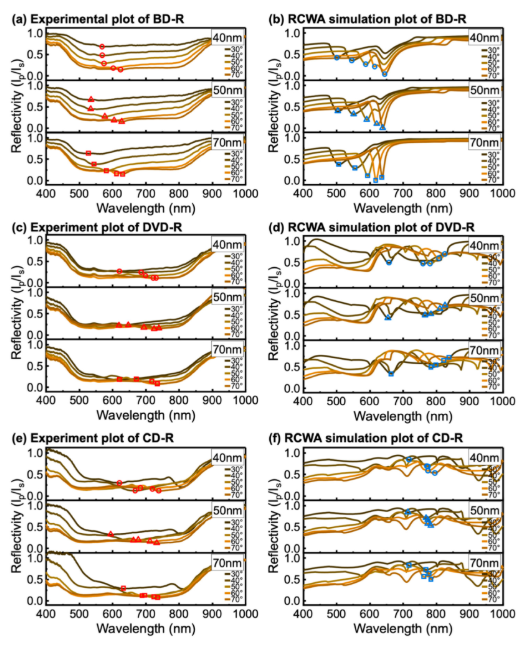
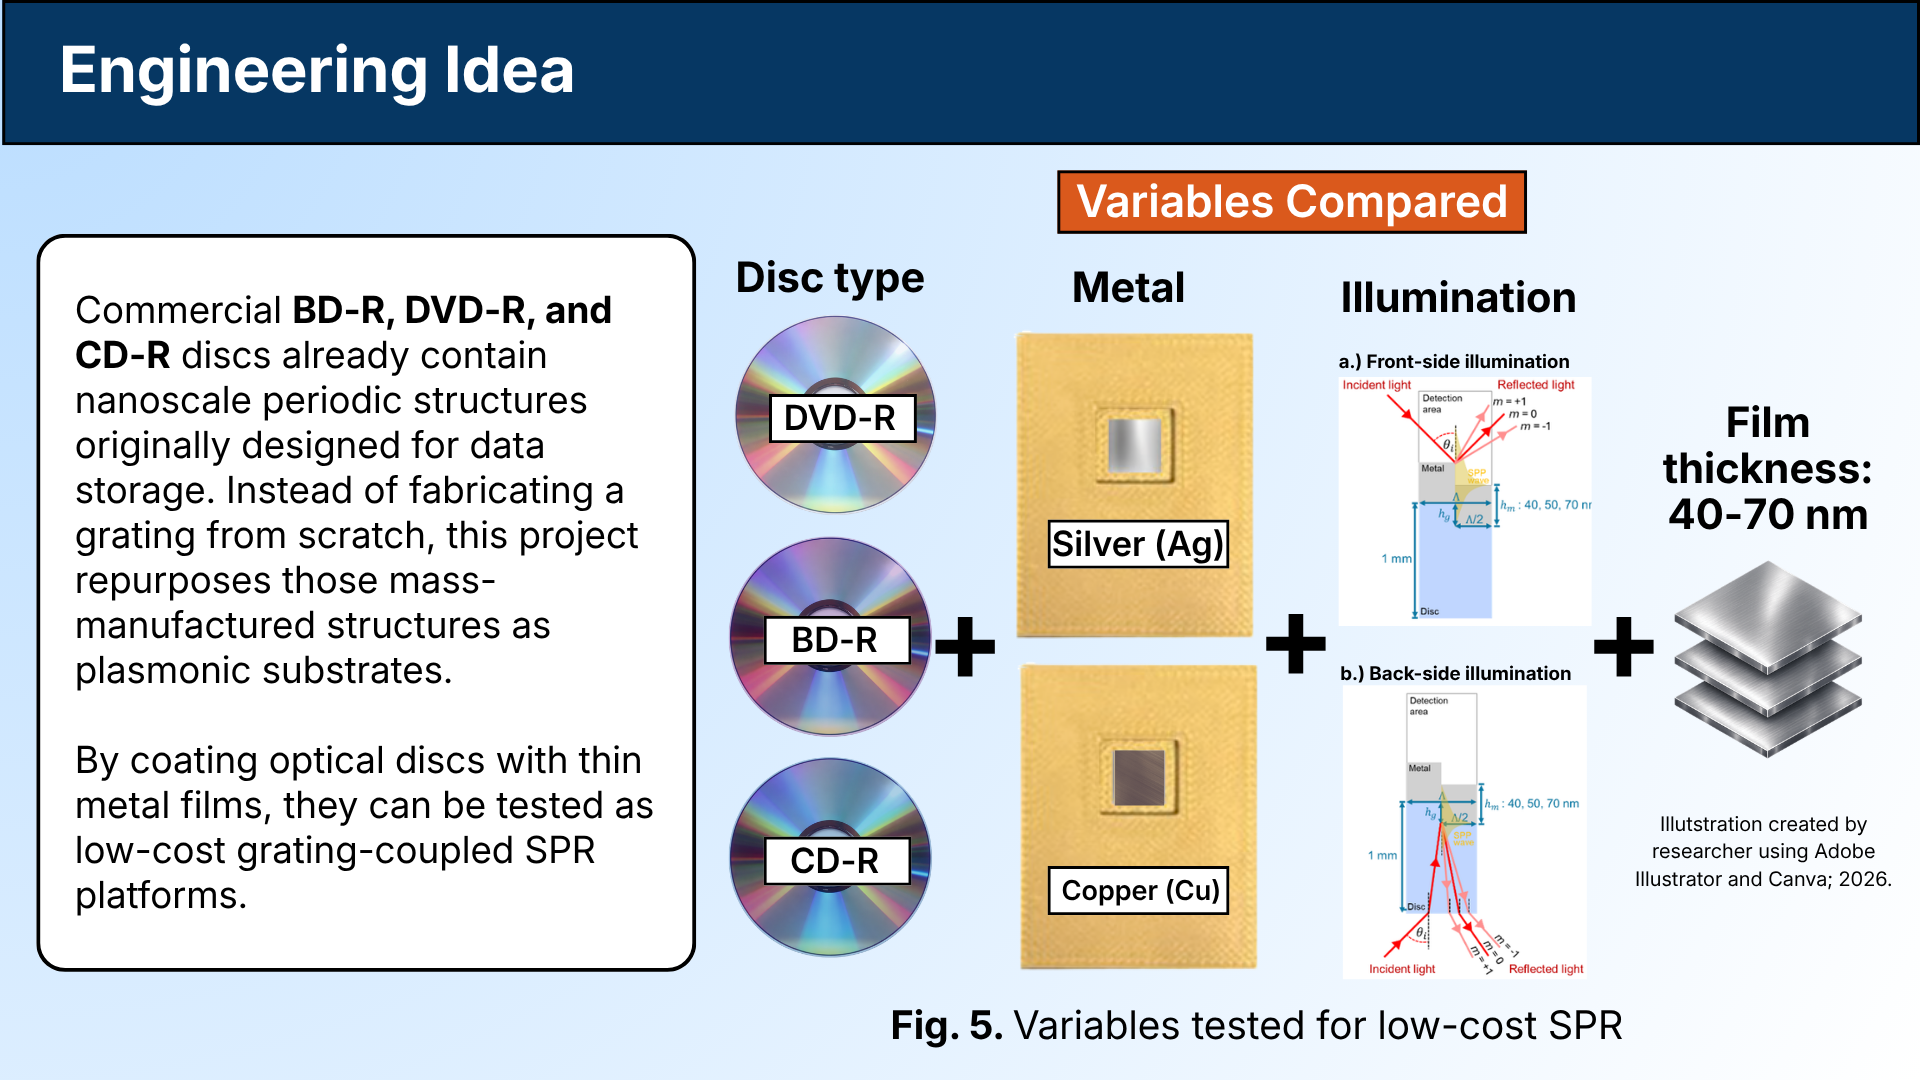
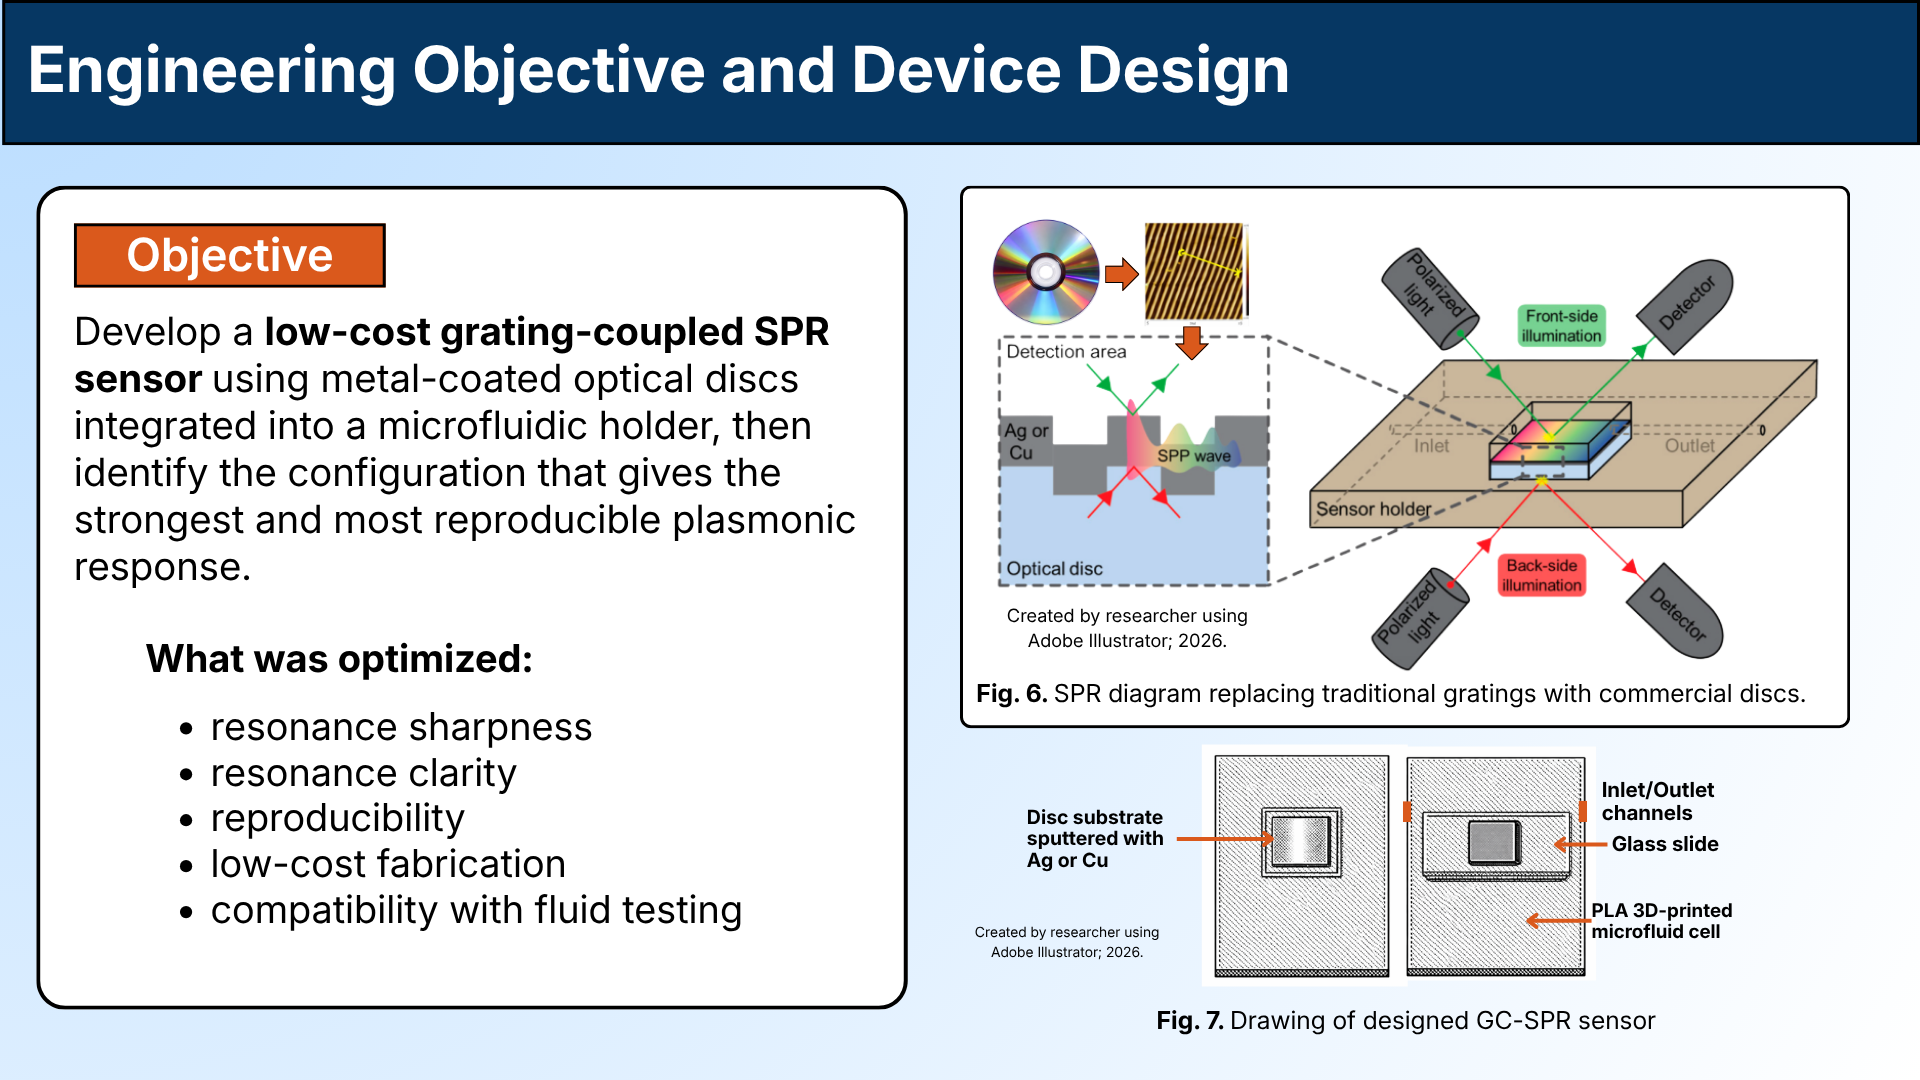
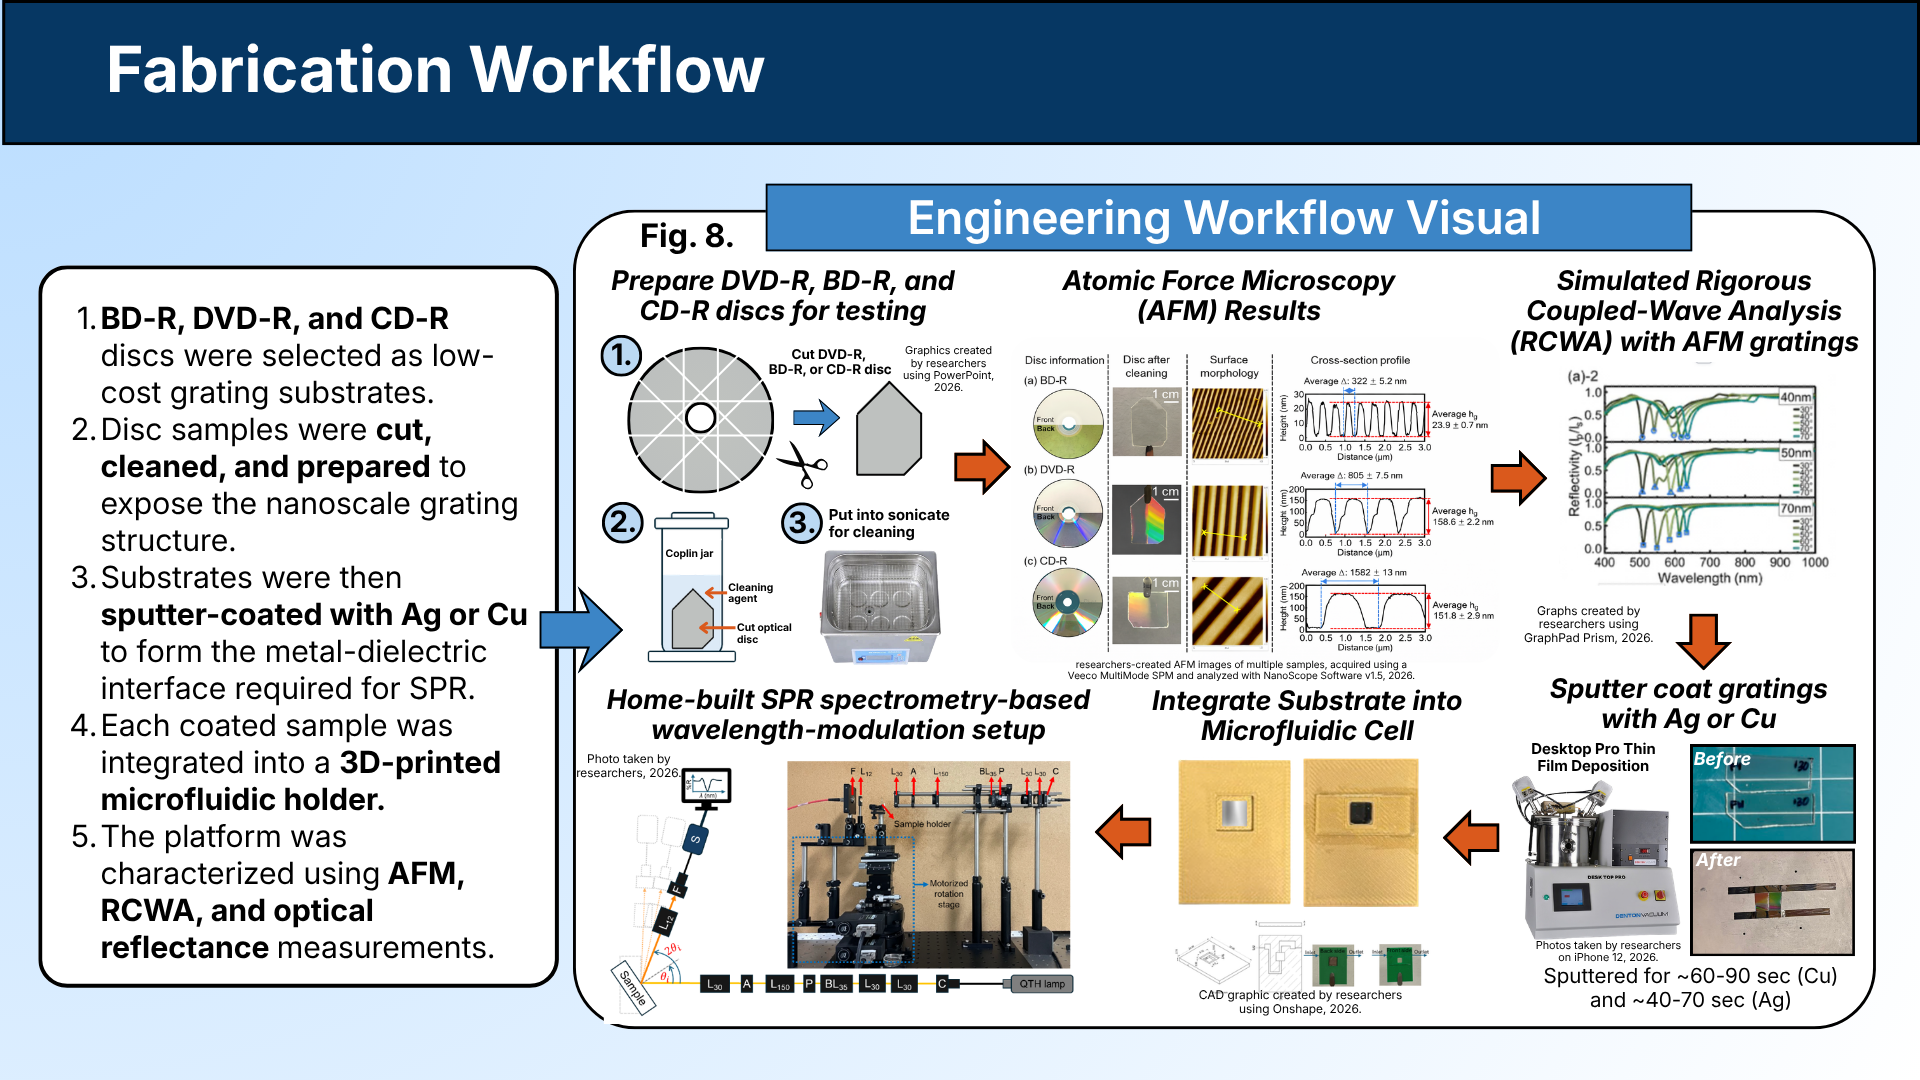
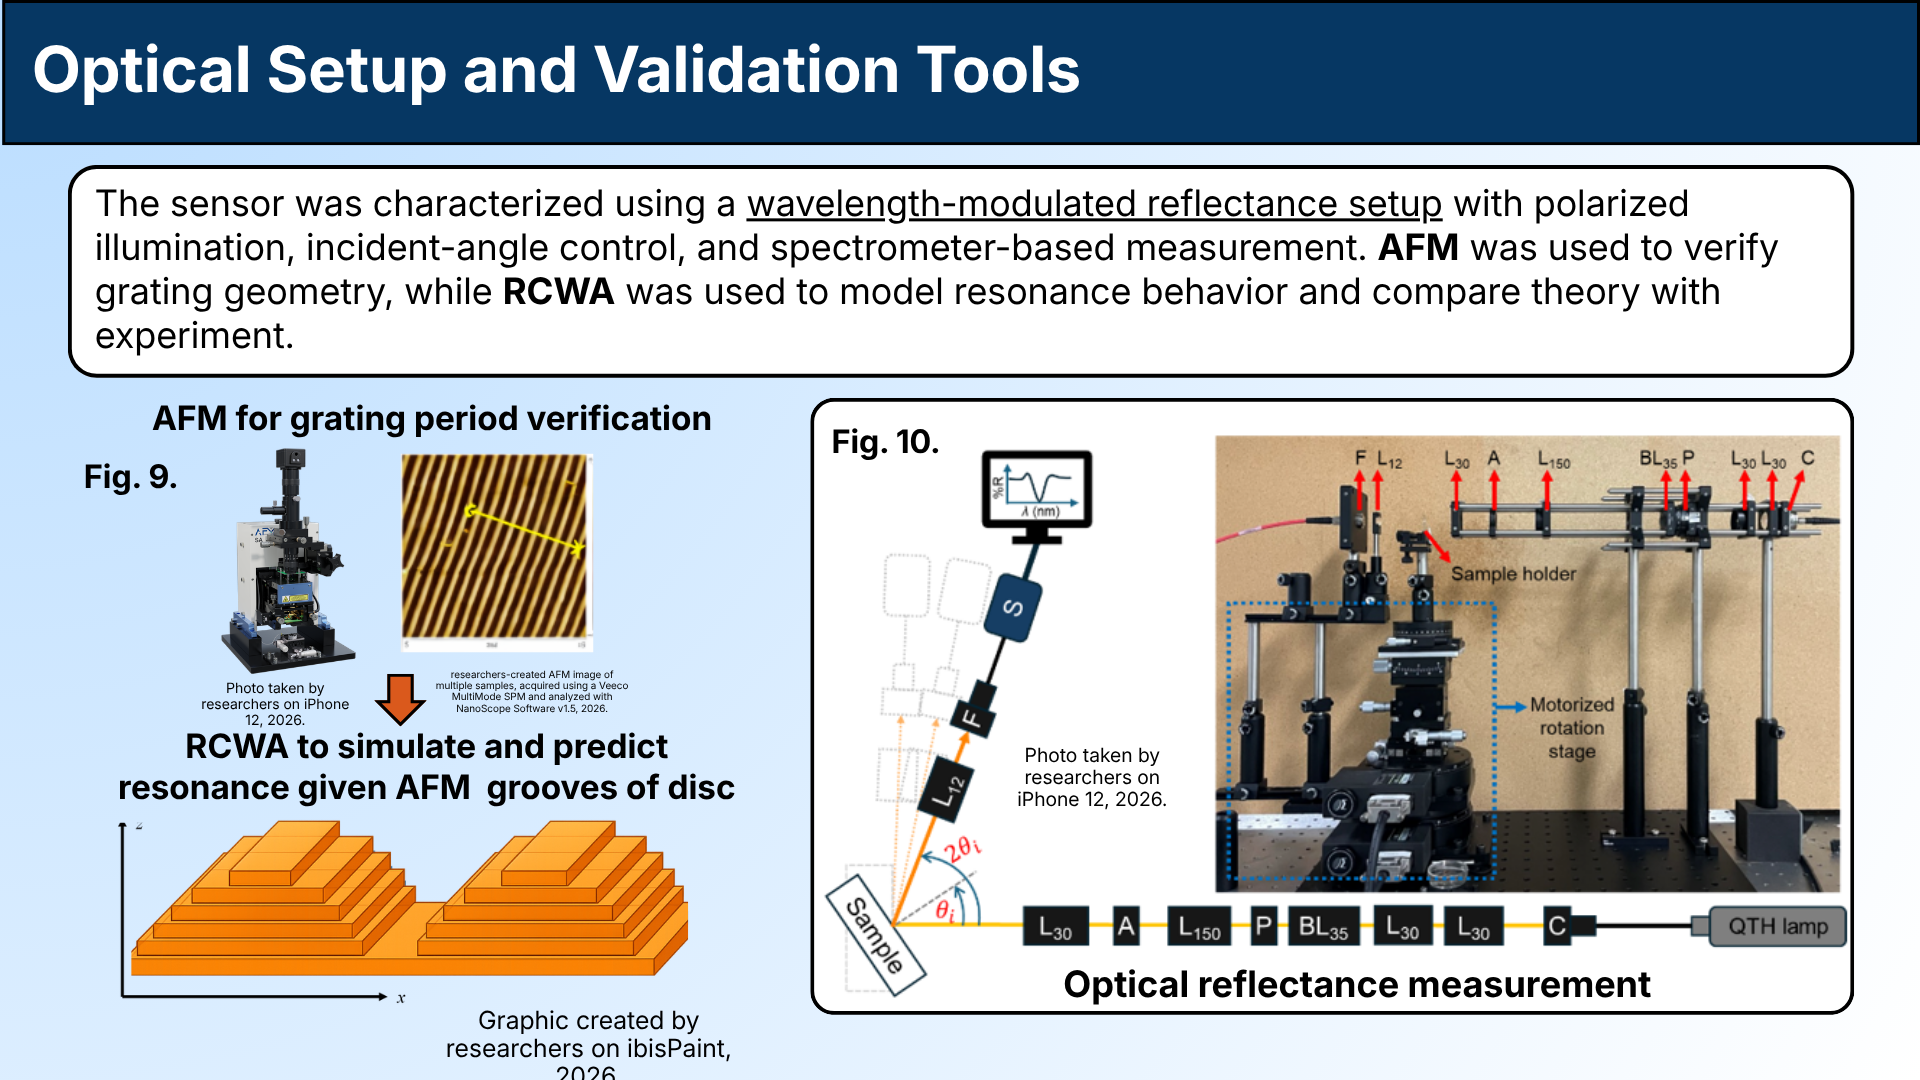
DiscSPR turns ordinary Blu-ray, DVD, and CD discs into sensor chips. The grooves already built into these discs can help create an SPR signal, which means the expensive nanostructured chip in a traditional sensor can be replaced with something cheap and mass-produced.
<$10sensor chip
~$200full setup
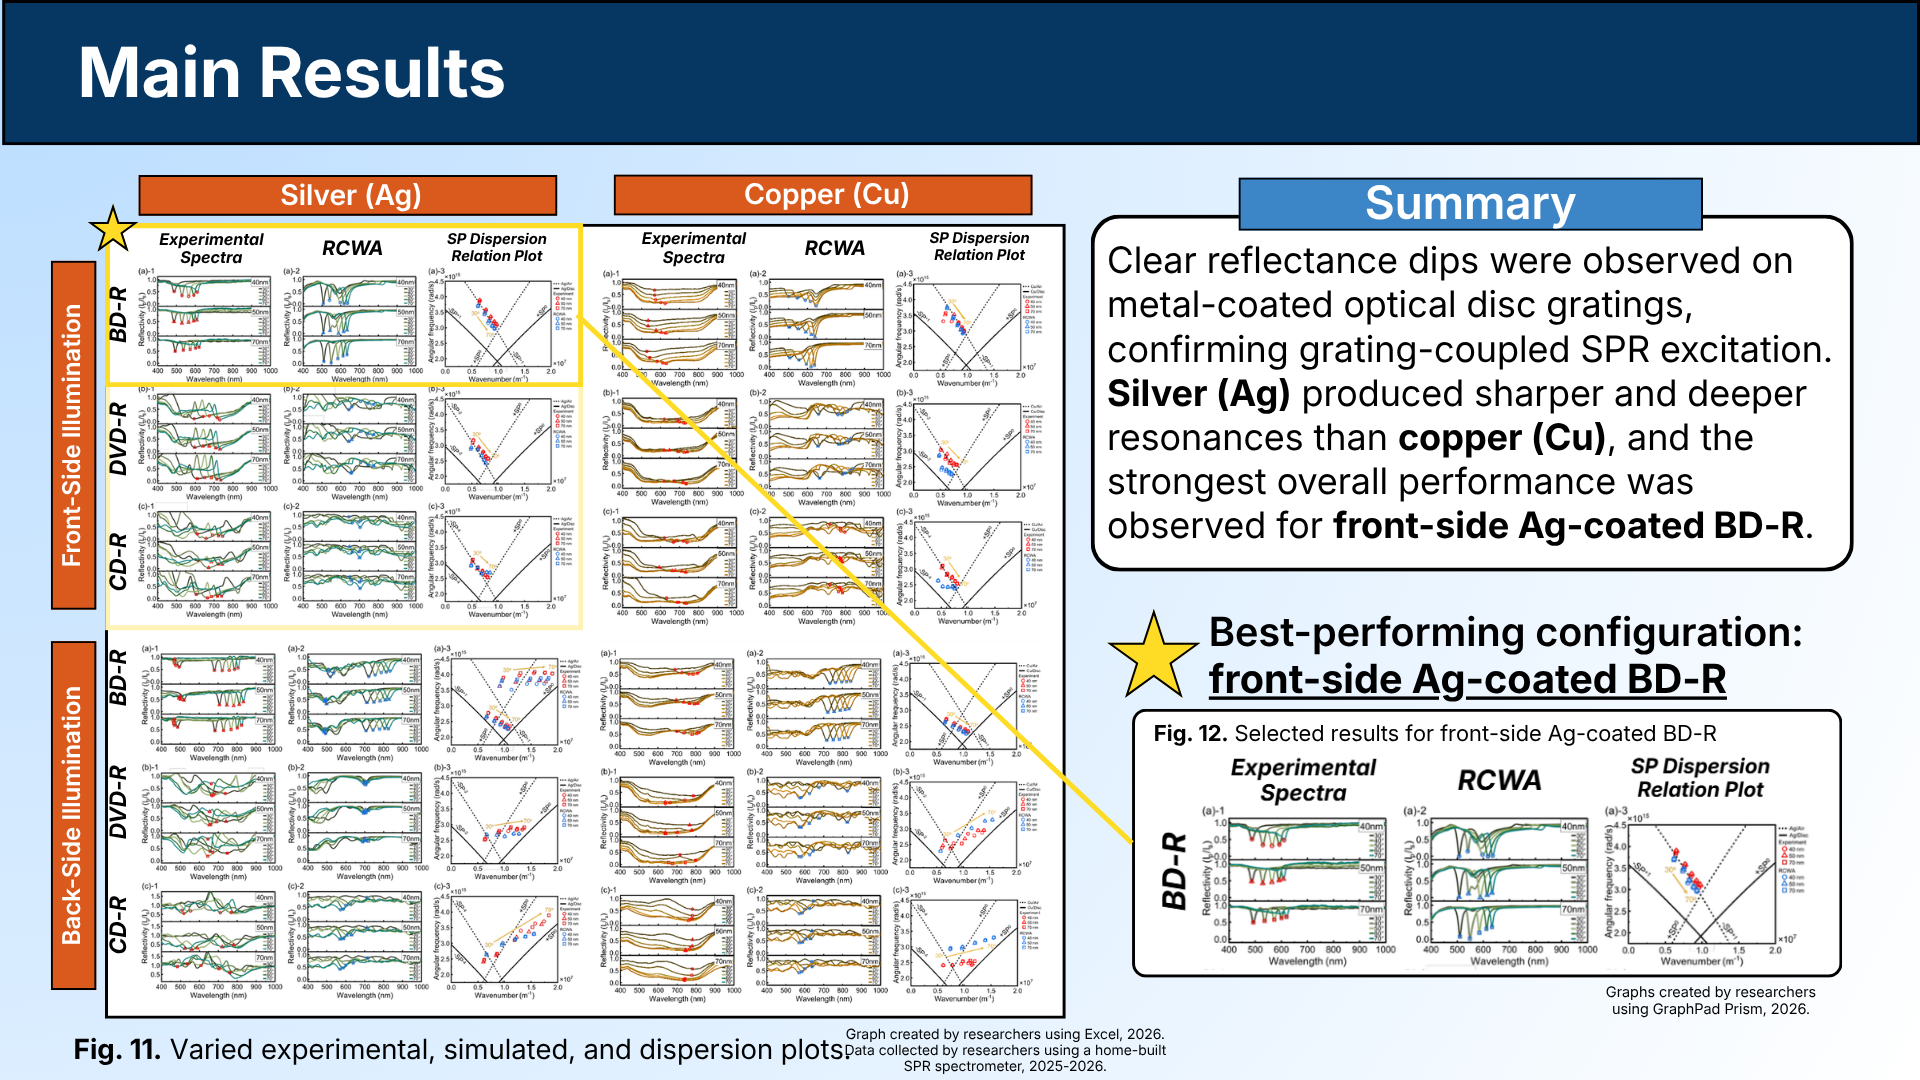
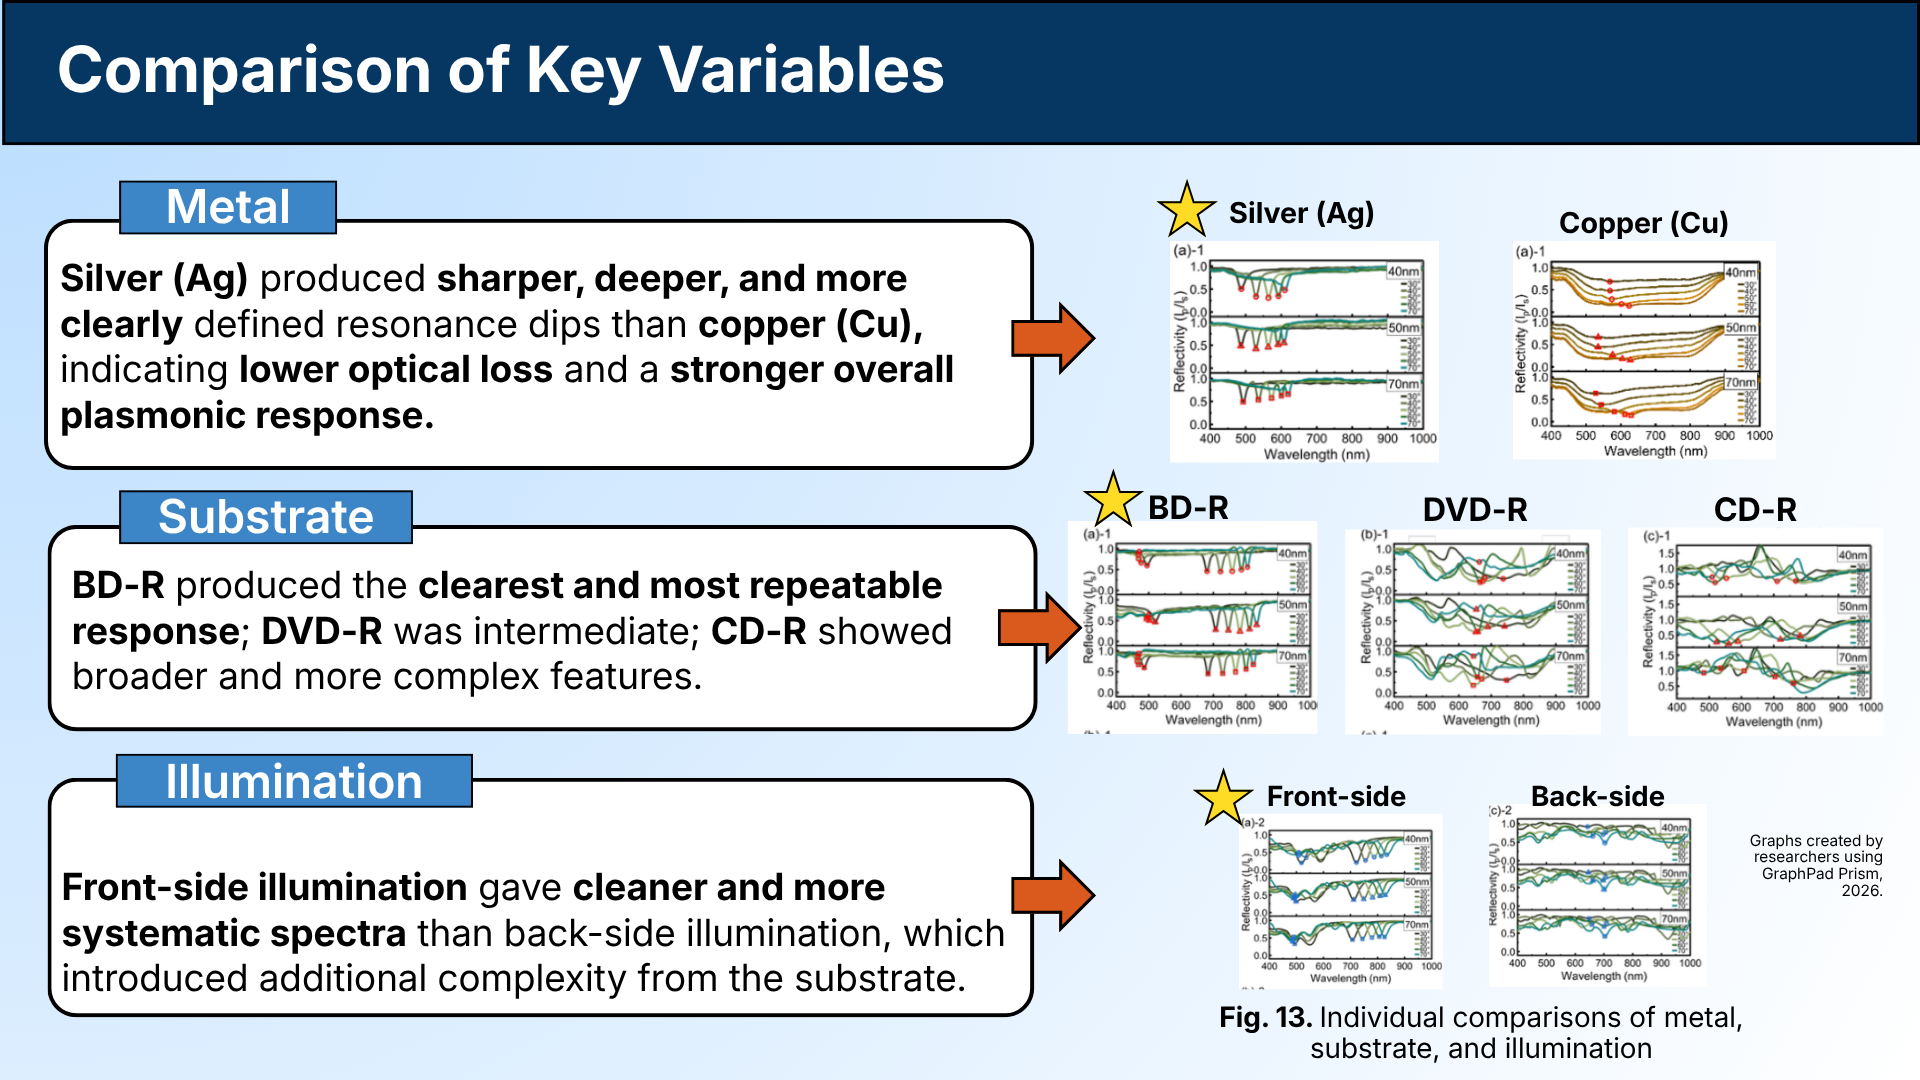
394nm/RIU peak
3disc types
 Regeneron ISEF Finalist
 Lockheed Martin
 Water Environment Association of Texas
 Office of Naval Research
 Stockholm Junior Water Prize
 Howmet Aerospace Foundation